 , fast delivery, and backed by our world-class customer service every step of the way.
  1-800-881-6093


 Back
Back
9 Proven Ways to Increase Your Ecommerce Store’s Average Order Value
Most advice on how to increase your average order value stops at the name of the tactic. Add a free shipping threshold, bundle your products, cross-sell at checkout. The list is sound and it hasn't changed much in a decade. What it leaves out is everything you need to put one of them live: the number to set the threshold at, where the setting sits in your admin, and how to tell six weeks later whether it made money or simply moved revenue around.
This is the detailed version. The definition and the formula first, then three reports worth pulling before you change anything, then nine tactics with the setup steps and the break-even math for each, and finally how to read the results.
Plan on an afternoon for the diagnostics and roughly two weeks per tactic after that. Instructions are Shopify-first, with the WooCommerce, BigCommerce and Salesforce Commerce Cloud equivalents where the platforms diverge. Amazon FBA works differently enough to need its own section, which you'll find near the end. Admin menus get reorganized periodically, so if a path doesn't match what's on your screen, the setting is usually one level up.
What is average order value (AOV)?
Average order value is the average amount a customer spends in a single order on your ecommerce store. It sits alongside traffic and conversion rate as one of the three levers on online store revenue, and it's the only one of the three you can move without paying more to acquire anybody. That's why learning how to increase average order value tends to pay back faster than any equivalent spend on acquisition.
How do you calculate AOV?
Divide your total revenue by the number of orders placed in the same period:
AOV = total revenue ÷ number of orders
$84,000 in revenue across 1,200 orders gives you a $70 AOV. Most stores track it monthly, and every platform will calculate it for you: Shopify under Analytics → Reports → Average order value over time, WooCommerce under Analytics → Overview, Amazon by dividing ordered product sales by order count in Business Reports.
Take one warning with the number before you act on it. AOV is a mean, and means get dragged around by outliers. Forty wholesale orders inside a set of twelve hundred will put your average somewhere no real customer actually lives, and you'd spend the next quarter optimizing against a figure that belongs to forty people. So the first job is looking at the distribution underneath it.
Start with three reports
Skipping this part is why most AOV projects go nowhere. You end up running the tactic that was easiest to install rather than the one your numbers were asking for.
Pull 1: the order value histogram
In Shopify: Analytics → Reports → Sales over time, set the range to the last 12 months, then export to CSV. Or go to Orders → Export → All orders → CSV if you want the raw rows, which is what I'd do. In WooCommerce, Analytics → Orders → Download. GA4 will give you a rough version under Monetization → Ecommerce purchases, though its revenue numbers rarely reconcile with the platform's, so treat it as a cross-check.
Once you've got the CSV, bucket the order totals in $25 increments and chart it. Then write down three numbers:
- your median order (the middle row, not the average)
- your 75th percentile
- the gap between them
That gap decides whether threshold tactics are worth your time. Under about $20 and your customers are clustered too tightly for a threshold to move anybody, so skip ahead to tactics 4, 5 and 8. Over $40 and you've got a long tail worth pulling on.
Pull 2: items per order and average unit price
AOV is items per order multiplied by average unit price, and the two problems have completely different fixes. Shopify's Sales by product report gives you units sold; divide by order count for the period.
Under 1.3 items per order means people are buying one thing and leaving. That's an attach rate problem: tactics 4, 5 and 8.
Over 2.5 items with a low AOV means people are filling baskets with cheap things. That's a unit price problem: tactics 1, 2 and 7.
Those cutoffs are rules of thumb rather than laws, and they're category-dependent. A supplements brand and a furniture brand should not be compared on items per order.
Pull 3: AOV split by segment
Run AOV separately for new versus returning customers, then by acquisition channel, then by device. Shopify's Customers section will segment new against returning; for channel you'll want GA4 or whatever attribution tool you're already paying for.
The pattern worth looking for is a flat blended AOV covering up two lines moving in opposite directions. Returning-customer AOV climbing while new-customer AOV slides is extremely common, and it usually means your acquisition mix has drifted toward discount-hunting traffic. No amount of cart merchandising fixes that; it's a paid media problem wearing an AOV costume.
Mobile AOV lagging desktop by more than about 20% is usually a cart UX issue rather than a customer intent one. Check whether your cart upsells even render on a phone. Half of them don't.
The two formulas the rest of this runs on
Keep these somewhere visible while you work.
Revenue per visitor = conversion rate × average order value
Nearly every tactic below moves both terms, sometimes in opposite directions. Raise a threshold and AOV goes up while the shoppers who can't reach it leave. Judge changes on revenue per visitor, otherwise you'll ship things that look like wins and aren't.
Contribution per order = (AOV × gross margin %) − CAC − fulfillment cost
This is the one that decides how hard you can bid. At $70 AOV and 40% margin an order throws off $28 before acquisition. At $95 it throws off $38. That $10 raises your ceiling on every keyword you compete for, which is the real reason work to increase average order value beats spending more on traffic: an ecommerce store that can afford $38 CAC wins customers from one capped at $28, using identical margins.
1. Free shipping threshold, set from your own break-even
The most effective item on this list and the one most commonly set to a round number somebody liked the look of.
Work out the floor first. The gap between where your orders naturally land and where you set the threshold has to clear this:
minimum gap = average shipping cost ÷ gross margin

example:      $9 ÷ 0.40 = $22.50
The logic: a customer who adds $22.50 to their order hands you $9 of margin at 40%, which is exactly what the free shipping now costs you. Anything less and you're paying for the privilege of a bigger order.
So if your median order is $60, your threshold floor is about $82.50. Round to $85. Setting it at $75, which is what most stores in that position do, loses money on every single order it moves.
Then calculate the subsidy bill, because the break-even above only covers orders the threshold actually shifted. Everyone already above it now gets free shipping they'd have paid for. From your Pull 1 export, count orders in the last 90 days above your proposed threshold, multiply by average shipping cost, then multiply by four. That's the annual give-away, and it's usually both a five-figure number and a surprise.
Setting it up in Shopify: Settings → Shipping and delivery → click into your shipping profile → on the rate, Add conditional pricing → Based on order price, minimum $85, rate $0. WooCommerce: Settings → Shipping → your zone → add the Free shipping method and set "A minimum order amount". BigCommerce puts it under Store Setup → Shipping as a free shipping method with a minimum subtotal. On Salesforce Commerce Cloud it's a shipping method in Business Manager under Merchant Tools → Ordering → Shipping Methods with a qualifying order-total condition, though most SFCC builds end up routing it through the promotions engine instead, and whoever maintains your cartridges will have views on which.
Three things people miss at this step:
- Exclude your oversized SKUs. One product that ships freight will eat the whole programme. In Shopify, put those items in a separate shipping profile so the conditional rate never applies to them.
- Set it on the subtotal after discounts, or a 20% off code will drag orders under your break-even while still qualifying.
- Check it against your international zones separately. A threshold that works domestically is often catastrophic to Canada.
The progress bar is not optional. A threshold nobody can see is just a shipping fee. You need the cart telling people "You're $12 away from free shipping" while they're deciding whether they're finished. Most modern Shopify themes have a cart drawer progress bar built in under theme settings; if yours doesn't, this is worth an app. Put it in the cart page and the mini-cart drawer. Mini-cart only is the most common half-implementation and it costs you the customers who navigate to the full cart.
Revisit it every quarter. Carrier general rate increases land every January and they move your break-even without asking. A threshold set in 2023 is almost certainly wrong now.
Where it goes wrong: copying a competitor's number. Their shipping costs, margin and order distribution are all inputs, and you can't see any of the three.
2. Spend-and-save discounts, after you check the required lift
"15% off orders over $100" feels like the same kind of lever as free shipping. It's far more expensive, because a percentage discount grows with the order while your margin percentage doesn't.
The formula:
required order growth = gross margin % ÷ (gross margin % − discount %)

at 40% margin, 15% off:  0.40 ÷ 0.25 = 1.6
The order has to grow 60% just to leave you where you started. Somebody who was going to spend $100 and stretches to $110 for the discount has cost you money.
It gets brutal as margins thin. At 30% margin the same discount needs the order to double. At 25% it needs 150% growth. When the discount rate reaches your margin rate the denominator hits zero and no order size gets you back to even.
Run your number, then compare it against the gap you measured in Pull 1. If your median order is $60 and 15% off requires a $96 order to break even, but your 75th percentile is $75, the promotion mathematically cannot work. Kill it before you build it.
Use fixed-dollar rewards instead of percentages. "$15 off orders over $120" caps your exposure, because the give-away stops growing once the order does. Shopify: Discounts → Create discount → Amount off order → set a fixed amount and a Minimum purchase amount. Percentage-off at a threshold sits in the same menu and it's the one I'd avoid. WooCommerce wants a coupon with a minimum spend under Usage restriction. BigCommerce and Salesforce Commerce Cloud both do this in their promotion rules engines, where the thing to check is how the new rule stacks with whatever else you have running, because order-level promotions compound in ways nobody intends.
Tier it if you're going to do it at all. $10 off $100, $25 off $200, $60 off $400. Tiers give the shopper a visible next rung and they let you concentrate the discount at order sizes where you can afford it. Show the ladder in the cart with the next tier highlighted.
A compliance note worth ten minutes of your lawyer's time: if you sell into the EU, the Omnibus Directive requires that any advertised price reduction reference the lowest price you charged in the previous 30 days. Permanent "was $80, now $60" pricing is a problem there in a way it isn't domestically. Don't take my word for the specifics, but do check.
Where it goes wrong: leaving it on permanently. A discount that never switches off becomes your price, and shoppers reset their reference point within about two purchase cycles.
3. Store credit issued after the order ships
Worth separating two things that get lumped together as "loyalty," because they behave completely differently on your P&L.
A checkout coupon discounts an order you had already won. It comes straight out of margin on a sale that was happening anyway.
Credit issued after fulfillment costs you nothing today. It only costs anything on the next order, which it also helps cause, and a decent share of it expires unredeemed. Redemption rates vary wildly by brand, so measure your own rather than trusting a benchmark, but the direction is reliable: you're paying less than face value for a purchase you might not otherwise have got.
How to run it without buying a loyalty platform. Shopify has native store credit on newer plans, or you can issue a unique single-use discount code per customer through Flow or your ESP. Trigger it on the fulfillment event rather than the order event, so the credit arrives with the shipping confirmation rather than the receipt. Set a 60-day expiry, which is long enough to feel generous and short enough to create a reason to act.
The reason this belongs in an AOV article at all: its first-order effect is purchase frequency, and frequency feeds AOV because returning customers usually spend more per order. Verify that in your own Pull 3 data before you build anything on it. If your returning-customer AOV is lower than new, you've got a subscription-style repeat pattern and this tactic works differently for you. Our longer piece on customer lifetime value and packaging covers that side of it.
One caution. Issue credit on a rhythm your customers can predict and they'll simply wait for it. Vary the trigger, or attach it to behavior rather than to every third order.
4. Cross-sells placed downstream of the decision
Cross-selling has the widest gap on this list between "installed" and "earning anything," and the gap is nearly all placement.
The rule I'd apply: never put a cross-sell in front of a decision that's still open. A grid of alternative products on a product page reopens a choice the visitor had already closed. You paid for that click and then spent your own real estate on undoing it.
The three placements that reliably work:
Add-to-cart confirmation. The decision is made, so complements are purely additive. In Shopify this is the cart drawer that slides in after add-to-cart. Two or three items, complements only.
The cart page. Basket is visible and the shopper is auditing it, so "goes with what you have" is genuinely useful. Keep it below the line items, never above.
The order confirmation page or post-purchase offer. The best real estate on your site and almost nobody uses it, because payment details are already captured and the friction that normally kills an impulse add has been paid. One caveat before you buy an app: Shopify's post-purchase offer runs on a checkout extension that isn't supported on every payment gateway, so confirm yours qualifies first. Otherwise you're limited to the thank-you page, which still works, just with a re-entry of payment.
Cap the count at three. Twelve suggestions is a catalog, and a catalog is another decision.
Social proof carries the add-on. A cross-sell asks somebody to buy something they didn't research, so the review count does more work here than it does on the product page they arrived on. Show the star rating and the number of reviews on every suggested item, and keep anything with fewer than about ten reviews out of the module until it earns them. An unrated add-on sitting next to a product the customer chose deliberately reads as filler, and it costs you the credibility of everything else in the widget. The same applies at the threshold: social proof on the item that gets somebody over your free shipping line is what turns a reluctant filler purchase into one they feel fine about.
Measure it with attach rate, not revenue. Attach rate is the percentage of orders containing at least one cross-sold item. Revenue attribution on these widgets is close to meaningless, because they get credited for anything in an order that happened to appear in the module.
Where it goes wrong: algorithms serving substitutes. "Customers also viewed" is a substitute engine by design, since it surfaces what people looked at instead of the thing in front of them. On a product page that's a conversion tax with a personalization badge on it.
5. Bundles built from your own attach data
Bundles get sold to you as a discount mechanism, which is the least interesting thing they do.
Most of the value is in removing decisions. Someone assembling a complete setup across six product pages has six chances to abandon; a bundle collapses that to one. It still works with a small discount, because what you removed was effort.
Find the pairs first. Shopify's report library includes Products purchased together on the plans that carry the full report set. If yours doesn't, export orders to CSV and count SKU pairs in a pivot table. Tedious for an hour, then you have the answer. What you want is pairs appearing together far more often than their individual sale rates would predict, which is the signal that a real relationship exists rather than two popular products coinciding.
Price it against blended margin. Work out the margin on the bundle as a whole and keep it at or above your normal rate. The return here shows up as attach rate and lower assembly friction, and you shouldn't need to buy it with margin. A 5–10% bundle discount does most of the work; 25% means you've turned a merchandising tool into a promotion.
Build it as a real product, not a discount rule. Shopify has native Bundles now, and it handles the inventory relationship properly, which discount-code bundles don't. If a bundle sells and the component inventory doesn't decrement, you'll find out during your busiest week.
Where it goes wrong: pairing a bestseller with something that isn't moving. Customers read that as clearance, accurately, and it drags the bestseller's perceived value with it. Every item in a bundle should be one somebody would buy alone.
6. Deadlines you can actually point to
Time-sensitive offers work. Fake ones used to.
Countdown timers that reset on refresh, "only 3 left" counters that never move, and a sale that ends every Sunday and returns every Monday are now recognized by a lot of shoppers, and they sit inside the FTC's ongoing attention to dark patterns. The short-term conversion bump may still be there; the downside has changed.
Real constraints are more persuasive anyway, because they're specific enough to be checked:
Production and shipping cutoffs. "Order by 4 December to arrive before the 15th" is a deadline with a reason attached. Build the calendar backwards from your carrier's published transit times plus your own pick-and-pack window, publish it on the product page, and update it weekly through Q4. This is the strongest honest urgency most stores have and it's badly underused outside of Christmas.
Batch or seasonal runs. If the run is genuinely limited, say the number and say why it's limited.
Real inventory positions. Actual counts, moving in real time, on the products where the count is genuinely low.
For anything made to order, the production calendar does this for free. A lead time is a hard constraint on a real machine and the customer can check it against their own delivery date.
The failure here is running urgency permanently. A store that's always 48 hours from a deadline has trained its customers that the deadline means nothing and that waiting gets rewarded.
7. Show the per-unit price falling while the quantity is still being chosen
Usually summarised as "show customers what they're saving," which misses the part that does the work. Timing is the whole tactic.
A cart that reports "you saved $34" after everything is in it has written a receipt. A quantity selector that shows the per-unit price dropping as the number climbs turns a price objection into a volume question. "Is this too expensive?" becomes "how many should I get?"
Setting it up. You need quantity breaks displayed on the product page with the per-unit price visible at each tier, not just the total. Shopify has native volume pricing for B2B catalogs; for DTC you'll need a quantity-break app, and the thing to check before buying is whether it shows per-unit price or only the discount percentage. Percentage-only displays lose most of the effect, because the shopper has to do the arithmetic themselves and won't.
Get the tier spacing right. Three tiers, roughly doubling: 1, 5, 10, or 250, 500, 1000. Tiers too close together read as noise.
This is straightforward in any category with a genuine volume curve. Custom packaging is a clean case, because per-unit cost really does fall as setup work amortizes across the run, so a buyer weighing 250 boxes against 500 is comparing two honest numbers rather than a manufactured incentive. When minimums are low the curve does most of the selling on its own.
The reference price has to be real. Savings shown against an inflated "compare at" figure is the oldest trick in retail, it's an active enforcement area on both sides of the Atlantic, and a shopper who catches it stops believing every other number on your page, including the true ones.
Where it goes wrong: advertising a per-unit price at volumes you can't fulfil profitably. If the curve is fiction below a certain quantity, don't publish that end of it.
8. Recommendations, with a holdout to prove they earn their space
The most-installed and least-validated tactic here. Nearly every store runs a "you may also like" module and very few can tell you what it's worth.
Attribution is why. These widgets get credited with any order containing a product that appeared in one, which sweeps in every sale that was going to happen regardless. A module reporting six figures of "influenced revenue" is frequently contributing nothing at all.
Run a holdout. Turn the module off for a random 10% of traffic and compare revenue per visitor between the two groups. Most personalization apps have this built in and never mention it, because the results are often embarrassing. If yours doesn't, you can do it crudely with a theme-level split on a hashed customer or session ID.
Give it enough volume to mean something. AOV data is skewed, so you need more orders than you'd expect: I'd want at least 1,000 orders per arm, or two full purchase cycles, before believing a result. And compare medians alongside means, since one $4,000 order will move a mean and tell you nothing.
What tends to survive a holdout:
- Session-grounded recommendations. What someone is looking at right now beats a profile assembled three months ago.
- Post-purchase placements in the confirmation email or page. No payment friction, high open rates, and the complement attaches to something already committed to.
- Replenishment timing. For consumables, a reminder at the right interval outperforms anything algorithmic, and all it requires is a date and an average consumption rate.
Where it goes wrong: recommending the thing the customer just bought. Common data bug, and it makes the entire system look broken to the one person you most wanted to impress.
9. Right-size the box, then brand it
Packaging usually appears in AOV articles as a closing note about unboxing delight. It earns a place on the list for a harder reason than that, which is that it sits directly upstream of tactic 1.
Dimensional weight is the mechanism. Carriers bill you on whichever is greater, actual weight or dimensional weight, and dimensional weight is a function of the box:
DIM weight (lb) = (L × W × H in inches) ÷ divisor
As of July 2026 the major US carriers have converged on 139, domestic and international. UPS, FedEx and DHL Express have used it for a while, and USPS moved from 166 down to 139 on 12 July 2026, applying it to parcels above one cubic foot. Plenty of third-party pages still quote 166, so if that's the number sitting in your shipping spreadsheet, it's out of date. Negotiated divisors do exist, so check your own contract before you plan around any of this.
Two rounding rules matter as much as the divisor does. Each fractional dimension rounds up to the next whole inch before you divide, and the result rounds up to the next whole pound. Skip those and you'll understate what you're actually billed.
Work an example. A 12 × 10 × 8 box is 960 cubic inches, so 960 ÷ 139 = 6.9, billed as 7 lb regardless of what the product weighs. Right-size to 10 × 8 × 4 and you're at 320 cubic inches, billed as 3 lb. Four pounds off every parcel you ship, which is a few dollars on most rate cards.
You don't have to do this by hand. Our dimensional weight calculator carries the current divisors and round-up rules for UPS, FedEx, USPS, DHL Express and Amazon Shipping, and flags the surcharge thresholds while it's at it. If the question is what the box should be rather than what your current one costs, the box size optimizer runs the 3D packing and gives you dimensions to order against.
Now feed it back into tactic 1:
before:  $9 ÷ 0.40 = $22.50 gap required
after:   $6 ÷ 0.40 = $15.00 gap required
You can drop your free shipping threshold by $7.50, which puts it inside reach of a materially larger share of your orders, which fires the mechanism more often. Go back to your histogram from Pull 1 and count how many more orders sit above the new number. That count is the return on right-sizing, and it's usually larger than the per-parcel saving that motivated it.
There are worked examples of how larger brands approached right-sizing if you want to see it at scale.
Then there's damage, and the churn hiding behind it. A parcel that arrives damaged is the most expensive order you can take. You've already paid the acquisition cost, the outbound shipping, the return label, the processing labor, and usually the unit as well, which turns an order with positive contribution into one that's badly negative. Run the numbers on your own damage rate and you'll find each claim costs somewhere between two and four times the item's margin.
The part that never reaches the returns report is that customer's second order. Pull the 90-day repeat rate for everybody who filed a damage claim last year and compare it against everybody who didn't. It takes twenty minutes and the gap is usually ugly. That's your packaging churn, and it's the number most operators have never looked at.
Right-sizing attacks this directly, since a product that can't move inside the box can't be damaged by moving inside the box. Less headroom, less void fill, fewer claims, and fewer of the returns you never wanted to process in the first place. If you want to put real numbers against the trade-off between material cost and what it saves you, we built a packaging ROI calculator that runs damage rate and repeat purchase alongside the per-unit cost.
The second reason is slower and harder to measure. The box is the only brand impression you're guaranteed to land. Everything else is competing for attention; the parcel arrives, gets handled, gets opened, sometimes gets filmed, and it has the customer's full attention at the exact moment they're deciding whether the purchase was a good idea.
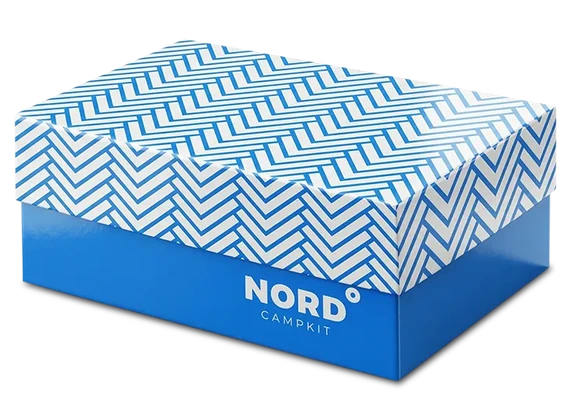
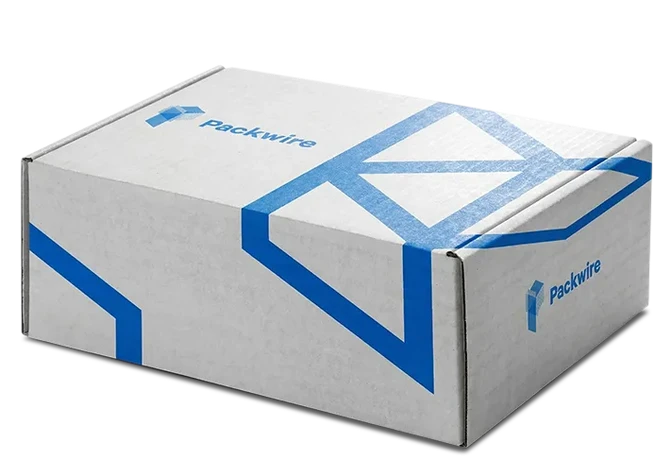
Which format you spend on depends on what that moment needs to do. A custom mailer box is the one that carries an unboxing, because it opens flat in front of the customer and the inside face is as visible as the outside, so it's the format worth paying for if your product photographs well or your customers post. A custom shipping box is the workhorse for heavier or multi-item orders, and printing the outside turns every delivery into a doorstep impression for whoever else happens to walk past it. Either one costs a fraction of what you paid for the click that produced the order.
Be honest about what branded packaging earns, though. It can't change the value of an order that's already been placed. What it moves is repeat rate, which shows up in your blended AOV a quarter later with a lifetime-value effect on top that's larger again. To attribute it properly, tag the cohort that received the new packaging and track their 90-day repeat rate against the cohort immediately before. Crude, but it produces a real number, and a real number beats an anecdote when you're defending the line item.
Budget it as a percentage of AOV. At $70 AOV, a $2 box is under 3% of the order, which is a rounding error next to what you paid to acquire that order, and it's the only part of the transaction the customer physically keeps. For higher-value products where presentation is part of what's being sold, folding cartons and rigid boxes carry more of the load, and the same percentage gives you a much bigger budget to work with.
Where it goes wrong: optimizing the box toward zero as a pure cost line. That's the right answer only if your customer's opinion of your brand is worth nothing, and you can test that assumption against what you paid for the click.
If you sell on Amazon, five of these change shape
Amazon takes the cart away from you. Shipping isn't yours to price, there's no checkout to place a cross-sell in, and "frequently bought together" is Amazon's algorithm making its own decisions about your catalog. AOV is still worth working, the controls are just somewhere else.
Track the right thing first. Units per order and revenue per session, from Seller Central → Reports → Business Reports → Detail Page Sales and Traffic, tell you more than AOV does here, because Amazon owns the basket and freely mixes your products with everybody else's.
Multipacks are the whole game. The most effective AOV lever on Amazon is listing a 2-pack, 3-pack or 6-pack as its own ASIN at its own price. It's a new listing rather than a setting, so it needs its own barcode and its own inventory, and it's still the first thing I'd do. You're raising order value without asking the customer to do anything except choose a different variant. The economics run in your favour too: referral fee is a percentage of sale price either way, while your fulfillment cost per unit drops.
Virtual Bundles, if you're brand registered. Groups two to five complementary ASINs into a single bundle listing with no new inventory and no prep work. Twenty minutes to set up. Brand Registry only, which is the catch.
Subscribe & Save does on Amazon roughly what issued store credit does in tactic 3. It goes after frequency rather than order size, and frequency is where the money is anyway. Eligibility depends on your account standing and product metrics, so check before you plan around it.
Quantity promotions through Seller Central's promotions tool will run "buy 2, save 10%" offers. Apply the required-lift formula from tactic 2 before switching one on. The referral fee comes off the discounted price, which softens the maths slightly, though nowhere near enough to skip it.
And the fee table is your packaging lever. FBA charges by size tier and unit weight, and size tier is decided by your outer dimensions. Dropping from large standard to small standard changes the fee on every unit you will ever ship through that ASIN.
This is the Amazon version of the dimensional weight arithmetic in tactic 9, and it hits harder, because it's a step function rather than a slope. Shrinking the box earns you nothing until you cross a tier boundary, then it earns you everything at once. Measure your product in its final packaging, overwrap included, and check it against the current tier table before you commit to a box size. An eighth of an inch over a boundary is an expensive mistake and you pay it on every unit for the life of the listing. Worth running the dimensions through the box size optimizer first, since finding the smallest box your product actually fits in is the same problem whether you're chasing a tier boundary or a shipping rate.
Two related notes. If your packaging qualifies as Ships in Own Container, you skip the Amazon overbox entirely and the customer opens your box rather than a brown one, which is the only route by which branded packaging survives this channel at all. And prep requirements get revised, so confirm against current policy rather than what passed two years ago; our Amazon FBA compliance guide goes through that side of it properly.
If you run both channels, split the work accordingly. Your own store is where the threshold, the cross-sells and the branded unboxing pay off. Amazon is where the multipack and the size tier pay off, and where the packaging spend has to justify itself on fees rather than on brand.
Reading the results
Ship one tactic at a time. Two at once and you'll never untangle which one did what, and one of them is probably cancelling out the other.
Give each change a full purchase cycle before judging, and at minimum two weeks. Then read four numbers in this order:
Conversion rate. Did it fall? A threshold set too high or a cross-sell placed too early lands here first, well before AOV has moved enough to look convincing.
Revenue per visitor. Conversion rate times AOV. If this hasn't moved, nothing happened, whatever the AOV chart says.
Contribution margin per order. AOV times gross margin, minus fulfillment. Discount-driven tactics come clean here. A spend-and-save promotion can lift AOV and revenue per visitor while pushing this down, and this is the number that pays for everything else you do.
The histogram again. A tactic that worked moves mass out of the lower buckets into the higher ones and you can see it at a glance. A tactic that only moved the mean has usually just found you a handful of unusually large orders, which happens every month for no reason at all.
Watch out for seasonality faking a result. If you launched a threshold in mid-November, Q4 will hand you a beautiful chart that has nothing to do with your work. Compare against the same period last year, not against last month.
A sensible order to do this in
If you're starting cold, this is roughly how I'd sequence it.
Week 1. Pull the three reports. Write down your median, 75th percentile, items per order, and the new-versus-returning AOV split. Calculate your free shipping break-even and your current subsidy bill. Nothing ships this week.
Weeks 2–3. Fix or set the free shipping threshold, and put a progress bar in both the cart and the drawer. Highest leverage, and you now have the number to set it correctly.
Weeks 4–5. Add cross-sells to the cart and the post-purchase page. Measure attach rate before and after.
Weeks 6–8. Pull your attach data and build two or three bundles from real pairs. Price them at or above blended margin.
Ongoing. Get a right-sizing review into your next packaging order, since that one has a lead time and it feeds back into the threshold you set in week 2. Run a holdout on whatever recommendation module you're already paying for. Then revisit the threshold every quarter, because the carriers certainly will.
None of these nine are secrets, and every online store competing with you has read the same list. What separates the ones that actually increase average order value from the ones that just get a nicer-looking dashboard is that the first group did the arithmetic before they shipped, and looked at revenue per visitor afterward.
